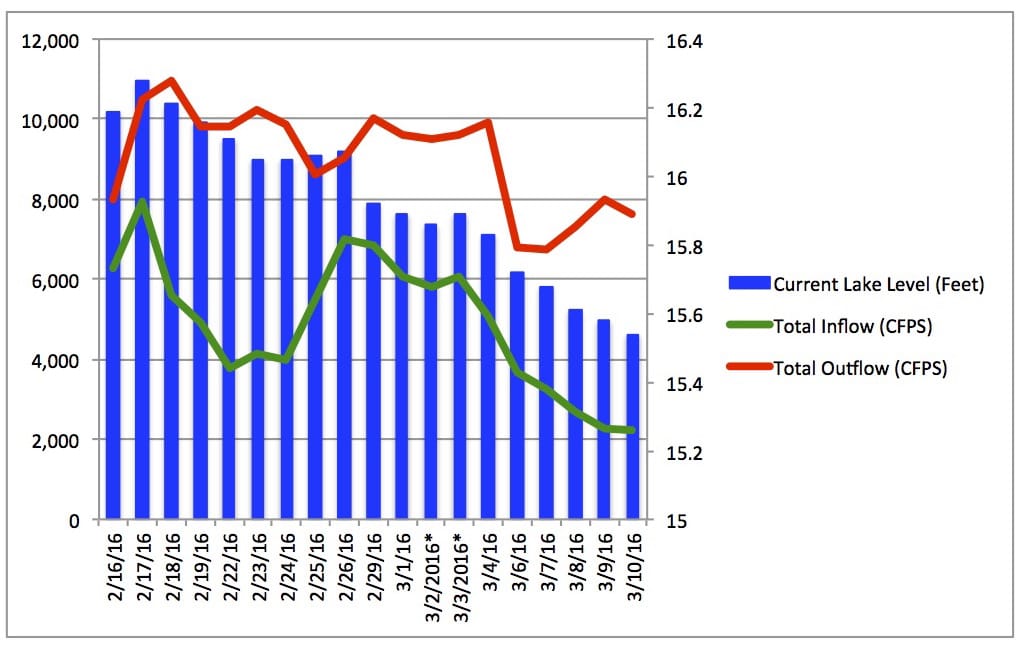
DEP’S Daily Lake Okeechobee Water Release Update, Friday, March 11.
Moderate afternoon thunderstorms for Saturday, Sunday, and Monday, with up to 0.5 inches of accumulation in some inland areas anticipated.
The Department of Environmental Protection issued the Daily Lake Okeechobee Water Release update.
For Immediate Release: March 11, 2016, 2:01 PM/E
“Caloosahatchee Salinity Conditions: Salinity (based on optimal conditions for adult oysters) is in the good range at Sanibel and Shell Point, and in the poor range at Cape Coral, but showing signs of recovery.
St. Lucie Salinity Conditions: Salinity at the U.S. 1 bridge remains the same and continues to be in the poor range.
Rainfall Forecast: Rainfall for the current week is forecast to be average. High pressure over the area will bring dry and breezy conditions today. Moderate afternoon thunderstorms for Saturday, Sunday, and Monday, with up to 0.5 inches of accumulation in some inland areas anticipated.”
Everglades WMA:
- Water level (average of 62/63 gauges) as of March 10 = 11.81 feet
- High water closure criteria = 11.60 feet
- Regulation schedule = 10.04 feet
- Recession rate for the last week = (0.17) feet
- Water level trend over the past 3 weeks = dropping
Rotenberger WMA:
- Water level as of March 10 = 13.02 feet
- High water closure criteria = 13.50 feet
- Regulation schedule = 12.72 feet
- Recession rate for the last week = (0.14) feet
- Water level trend over the past 3 weeks = dropping
Holey Land WMA:
- Water level as of March 10 = 12.18 feet
- High water closure criteria = 12.50 feet
- Regulation schedule = 11.43 feet
- Recession rate for the last week = (0.21) feet
- Water level trend over the past 3 weeks = dropping”
For more information and the complete data, please see DEP.

